Scatter Plot
Lets plot two overlapping gaussian 2-dimensional distributions centered at (-1.5, 0) and (1.5, 0) using 200,000 data points.
import java.util.Random

import xyz.devfortress.splot._

def main(args: Array[String]): Unit = {
  val fig = new Figure(
    xTicks = Ticks(-6 to 6), yTicks = Ticks(-5 to 5),
    domain = (-6, 6), range = (-5, 5),
    title = "Overlapping Gaussian Distributions",
    showGrid = true
  )

  val rnd = new Random()
  val gs = (0 to 100000).map(_ => (rnd.nextGaussian() - 1.5, rnd.nextGaussian())) ++
    (0 to 100000).map(_ => (rnd.nextGaussian() + 1.5, rnd.nextGaussian()))

  fig.scatter(gs, pt = ".")
  fig.show(730, 500)
}
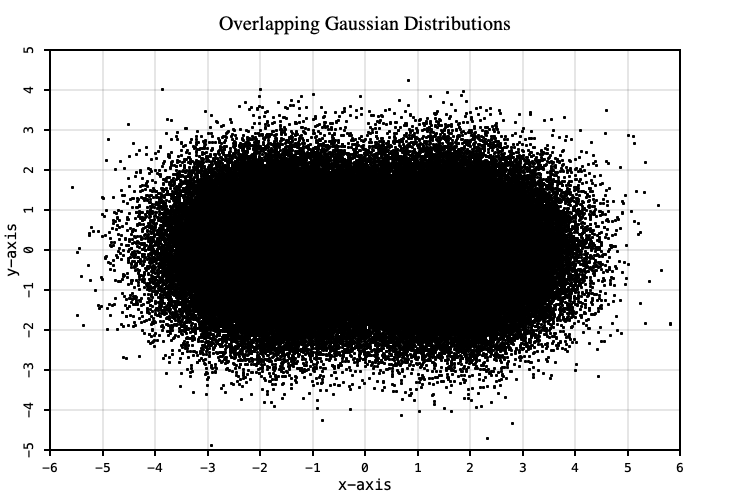
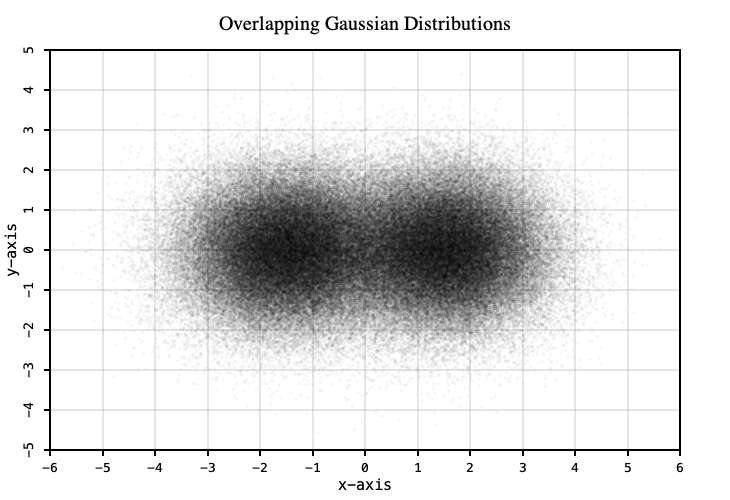
Due to the high density of points at the centers of distributions internal structure is not really visible. You cannot see that there are too peaks in there. Common solution to this problem is to plot points of the distribution semi-transparent. Since color density of semi-transparent objects is additive, by adjusting value of alpha channel and point size we can make dense scatter plot to reveal its internal structure. We can do that like so:
// Alpha channel is set to 255 * fa. Fully opaque 'fa' (default) value is 1 and
// fully transparent is 0.
fig.scatter(gs, pt = ".", fa = 0.036)