Simple Line Plot
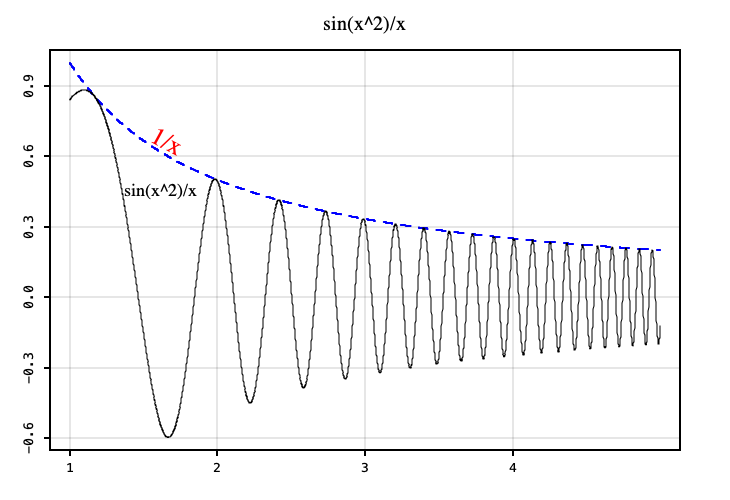
Lets draw a function f(x) = sin(x^2)/x on the domain [1,5].
import java.lang.Math.{pow, sin}

import xyz.devfortress.splot._

object SimpleLinePlotExample {
  def f(x: Double): Double = sin(pow(x, 3)) / x

  def main(args: Array[String]): Unit = {
    val fig = Figure(
      title = "sin(x^2)/x",
    )
    val xs = 1.0 to 5.0 by 0.001

    fig.plot(xs.map(x => (x, 1/x)), color = "blue", lw = 2, lt = "--")
    fig.plot(xs.map(x => (x, f(x))))
    fig.show(730, 500)
  }
}
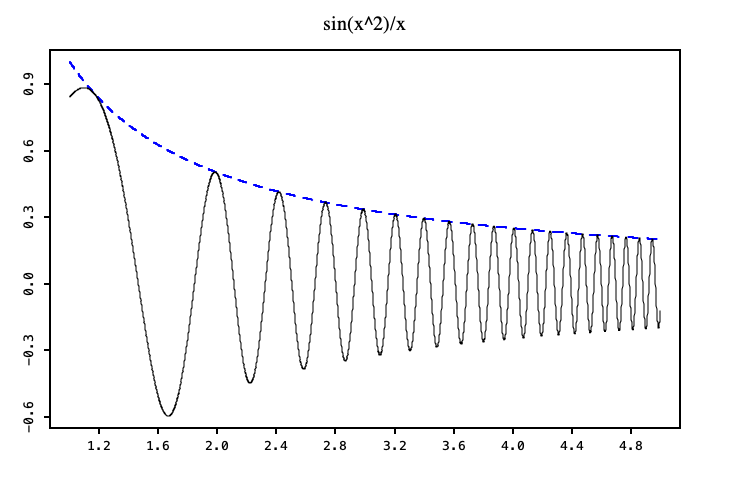
Notice that domain and range of the plot was automatically derived and some padding was added on both axis. Position of ticks was also automatically derived but we may want to set them explicitly. Let say we want to set them on the x-axis at points 1, 2, 3 and 4 and also show grid associated with them. We can do that like so:
val fig = Figure(
  title = "sin(x^2)/x",
  showGrid = true,
  xTicks = Ticks(1 to 4),
)
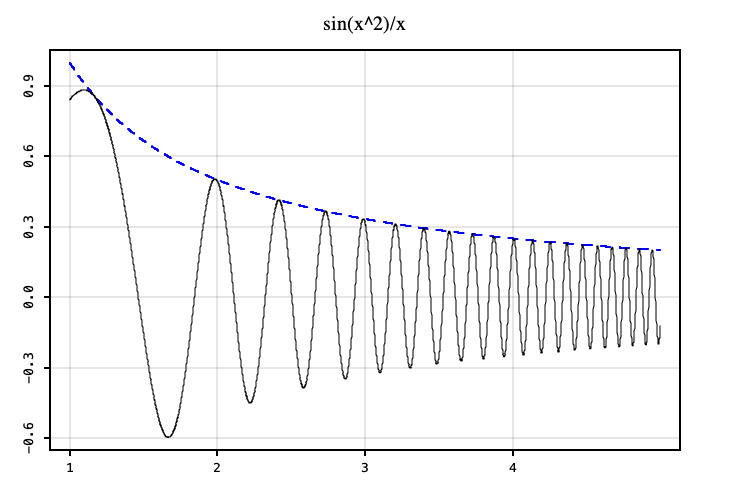
SPlot currently does not create automatic legends but we can add labels.
fig.add(Label("sin(x^2)/x", 1.37, f(1.36), font = Font.decode("Times-18")))
fig.add(Label(
  "1/x", 1.54, 1/1.5,
  font = Font.decode("Serif-25").deriveFont(AffineTransform.getRotateInstance(0.5)),
  color = Color.RED
))